


5. Typical Receiving Measuring Station IS-2 of the System of Active Electromagnetic Monitoring of Stressed and Deformed State of the Earth’s Crust
Since 2005, the Research Station RAS has been working on modernization of the system of active electromagnetic monitoring of stressed and deformed state of the Earth’s crust which was created in 1982 and operated by the Research Station. These works are aimed at development of the modern receiving measuring station to be installed on receiving measuring sites of the system of electromagnetic monitoring of the Earth’s crust.
In 2007-2008, within the frameworks of the State Contract № 02.515.11.5014 dated April 5, 2007, the Research Station has developed the draft technical and operational documentation, and has constructed 10 model samples of IS-2 measuring stations to be installed on receiving stationary and mobile measuring sites of the system of electromagnetic monitoring operated by RS RAS instead of old single channel stations КИЦ-М and ИКМ. Since 2009, we have installed the new IS-2 stations onto all of the stationary and mobile measuring sites of the monitoring system.
The IS-2 station is a semi-automatic multi-channel measuring system designed for registration and preliminary processing of signals from the sounding electropulse plant observed in the receiving measuring sites on the clips of the four transducers of electrical type which are the grounded electric dipoles oriented to the four directions on the еarth’s surface.
The IS-2 station was constructed on the base of modern elements base and using the microprocessor and other elements of higher integration level. Fig. 13 shows the structural and functional scheme of IS-2 station.
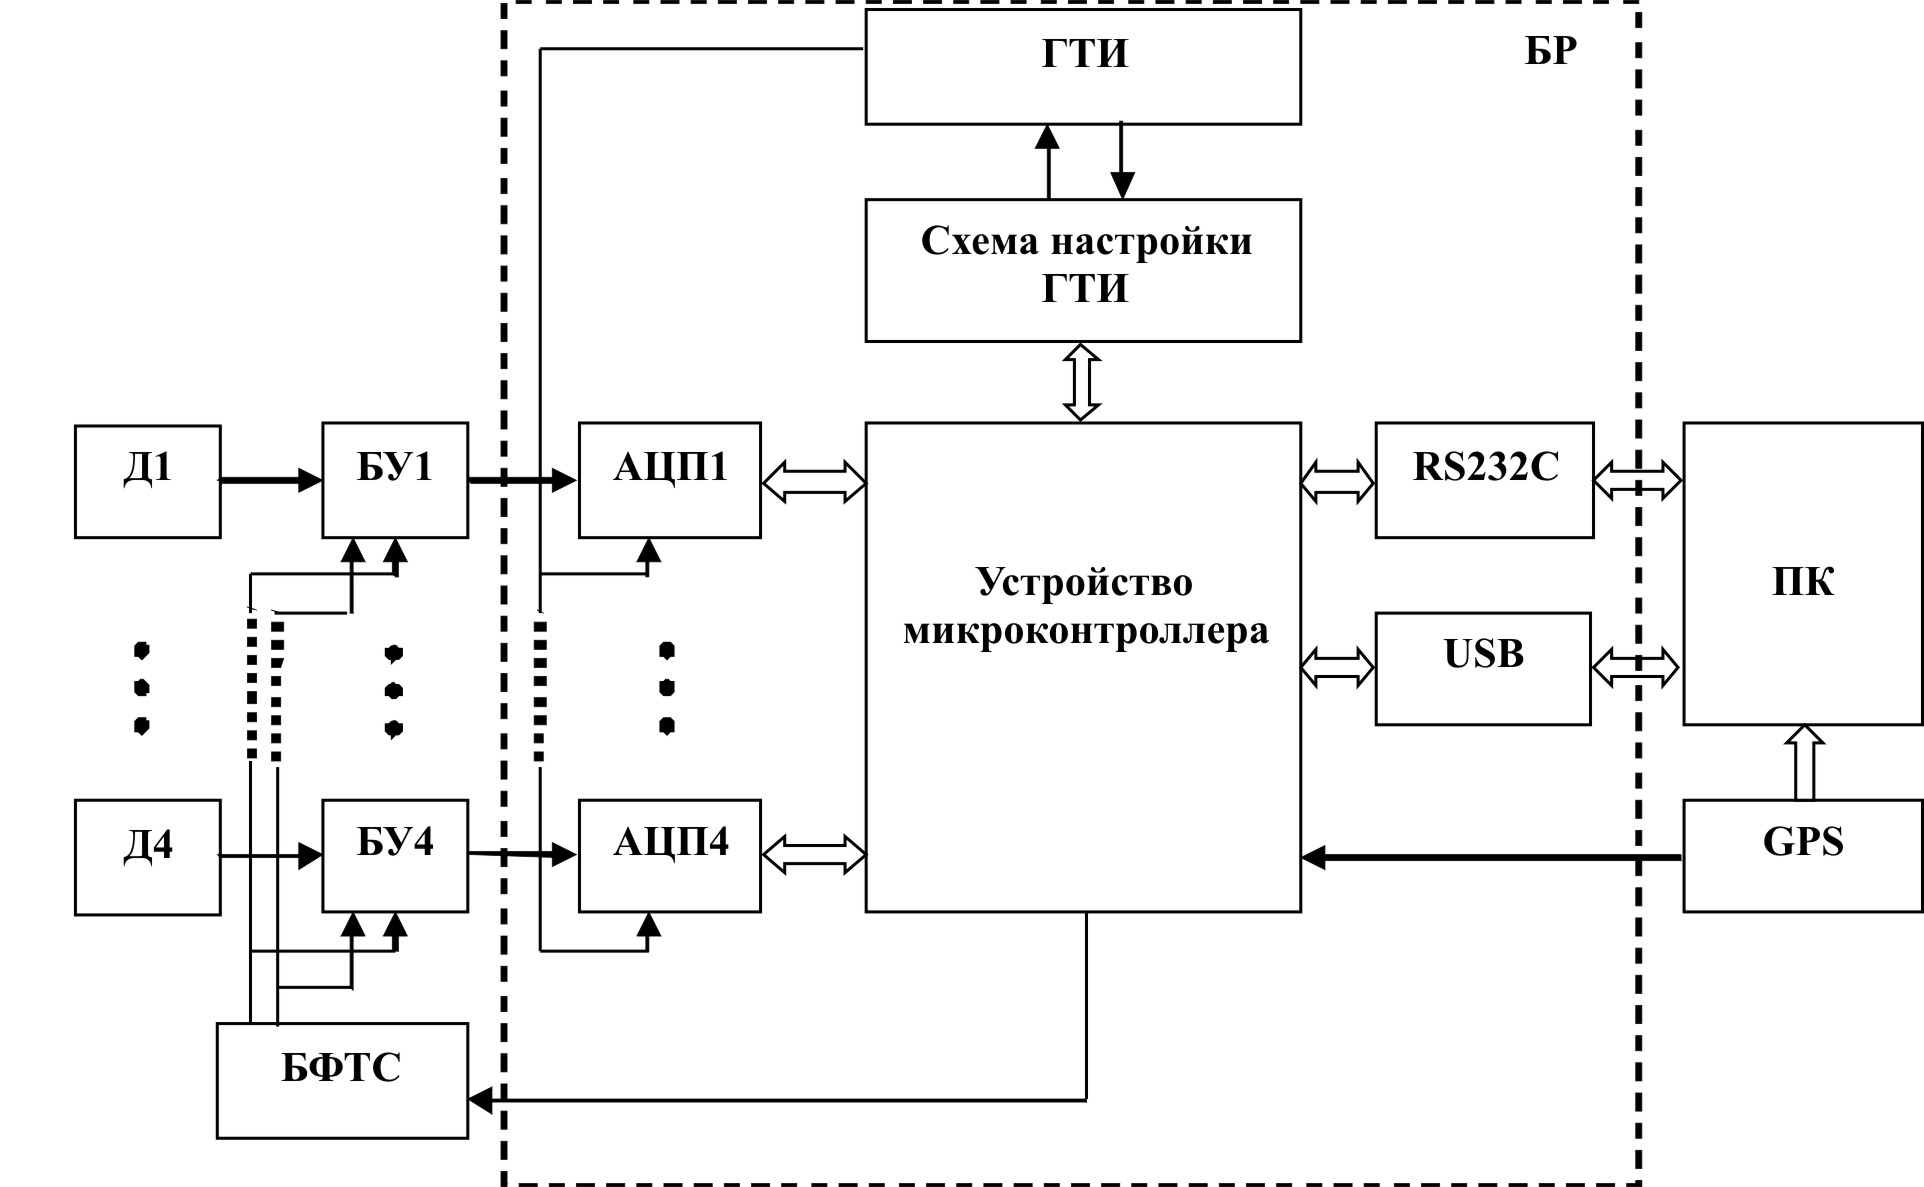
Fig. 13 Structural and functional scheme of IS-2 measuring station:
Д1 – Д4 – electric field transducers (electric dipoles);
БУ1 – Д4 – blocks of transducer signals amplification;
БФТС – block of test signal shaping;
БР – registration block;
АЦП1 – АЦП4 – analog-digital converters;
ГТИ – clock pulse generator;
RS232C, USB – interface circuits (input/output ports);
ПК – external personal computer;
GPS –satellite navigation system receiver.
Major technical specifications of IS-2:
Number of measuring channels …………….……………………………………..…4
Input resistance, mega ohm ……………………………………..………….……….…1,0
Bandwidth, Hz ……………………………………………….………..…….0 ÷ 20
Dynamic range, dB………………………….…………………….…………….120
Level of self-noise, microvolt ……………………………………….………………...2
Industrial interference rejection (50 ± 1) Hz, dB………………….………………...80
Synphase signal rejection (interference), dB………………………….……………....60
Sampling frequency, Hz…………………………….…………………………………800
Instability of time parameters of registration ……………………..….....10-8
Voltage of primary power supply (batteries), V ………...………..12
Capacity of storage battery, А·hour………………………………………...….…120
Time of continuous running without recharging, hour………………..…………………....10
The measuring station IS-2 can be used both at stationary measuring sites (fig. 14) and at mobile sites (fig. 15).
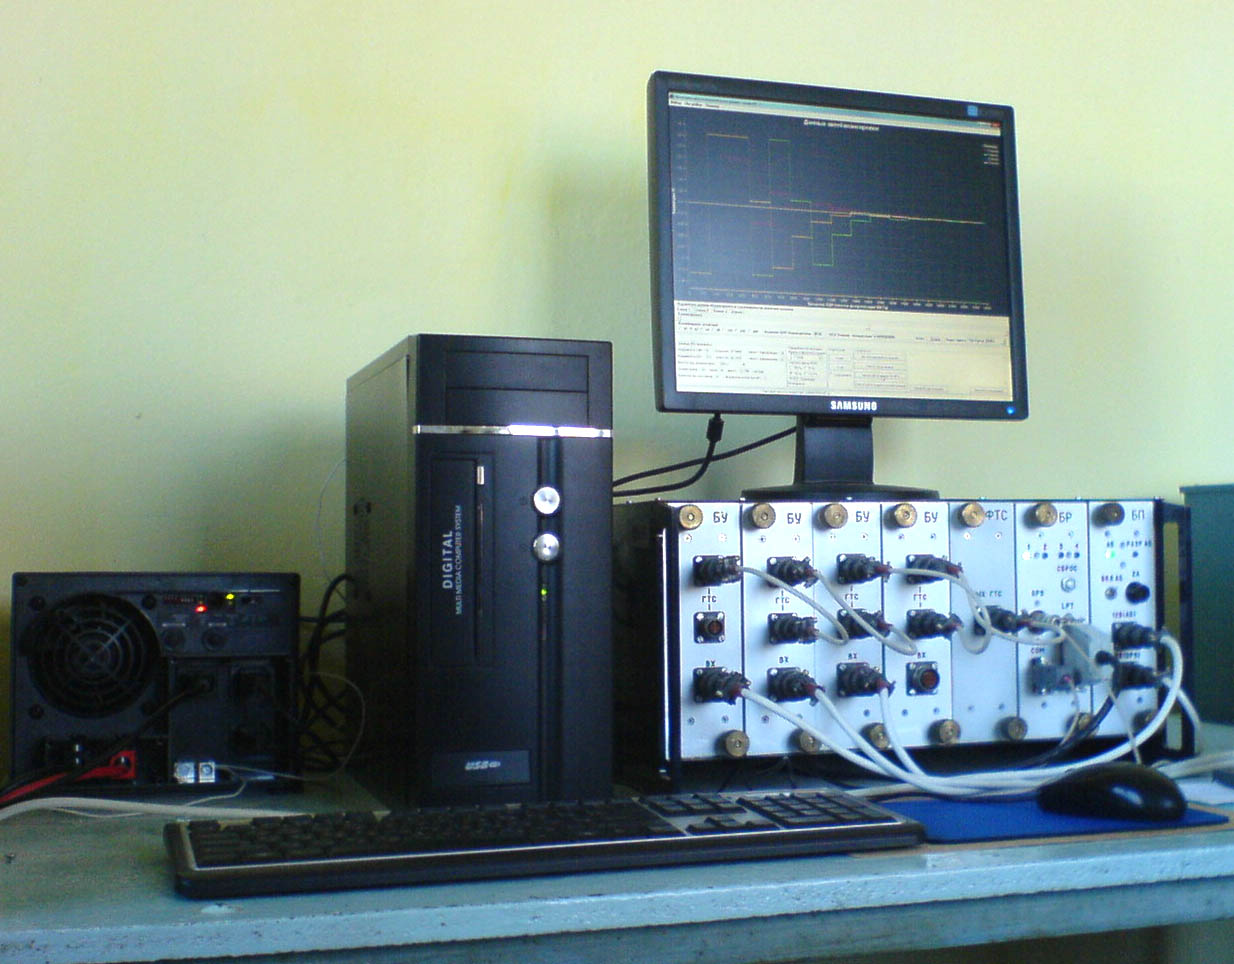
Fig. 14. Measuring station IS-2, stationary performance
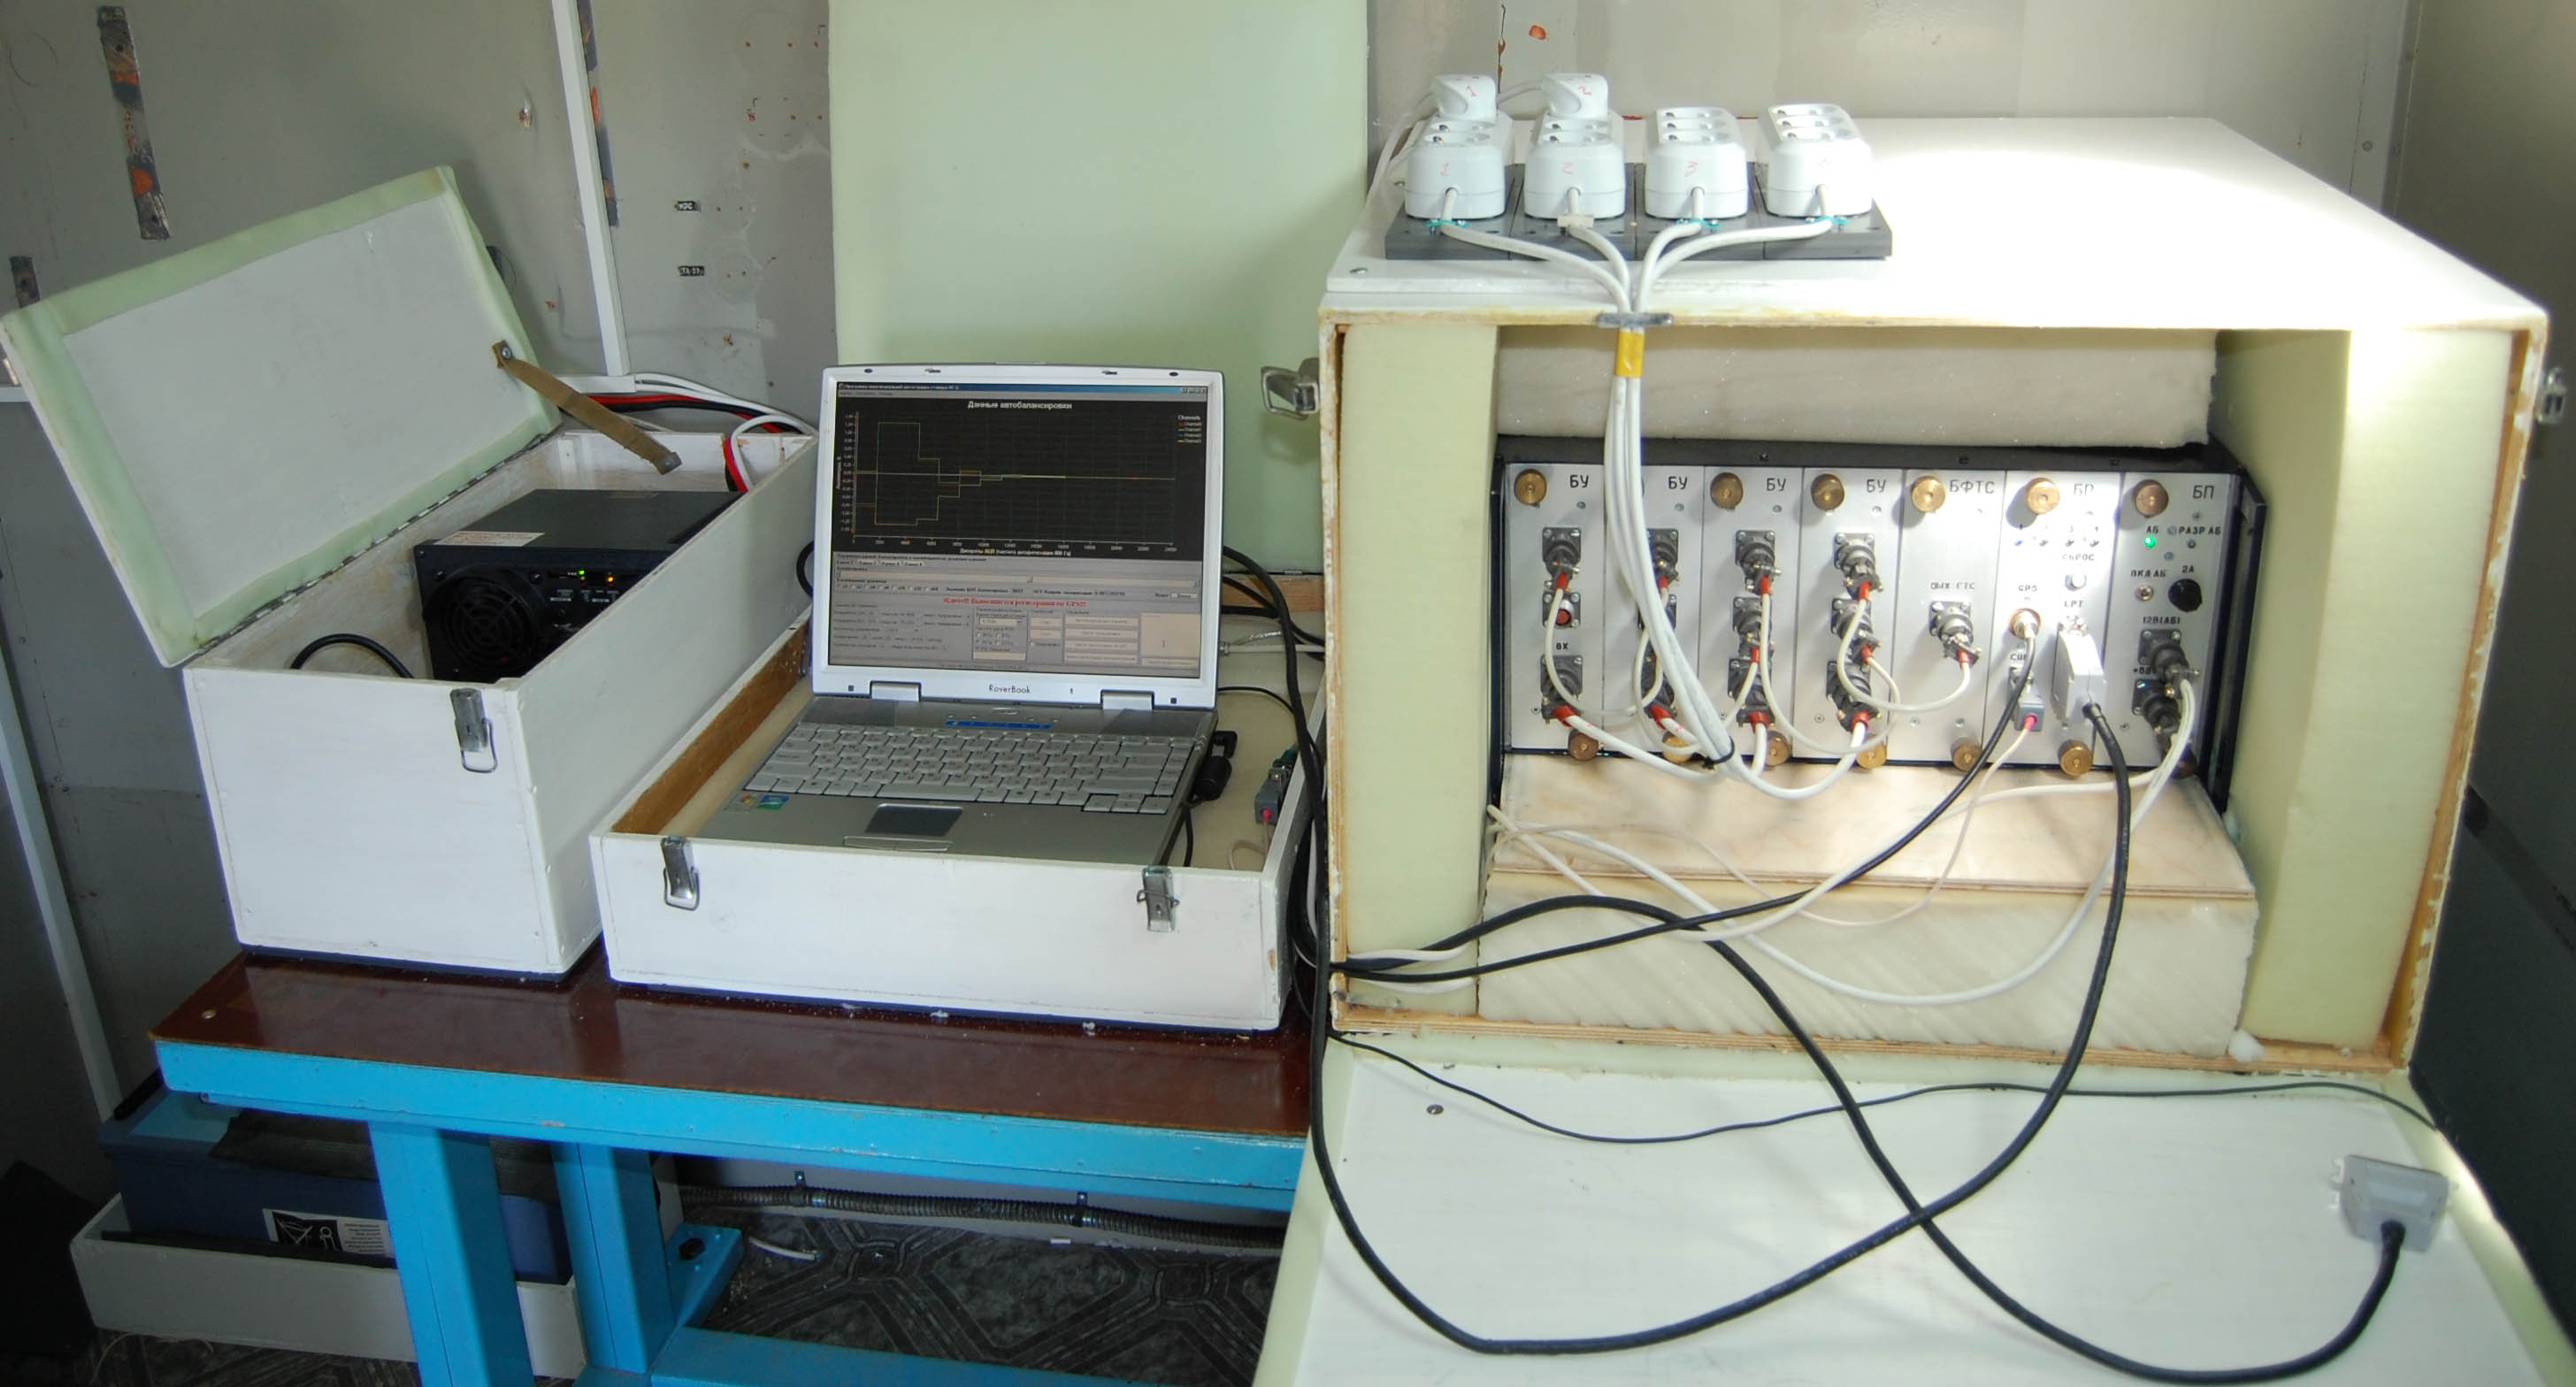
Fig. 15. Receiving measuring station IS-2, mobile version of performance
The IS-2 can operate synchronously with the sounding electropulse system. It has improved accuracy and stability of sampling rate of recorded signals. Therefore, IS-2 has got improved accuracy of measurements of transient curve parameters. Circuit solutions which provide high accuracy of IS-2 are supported (protected) by the patent for invention of the
Fig.16 shows the example of signals from the sounding electropulse system ERGU-600 recorded at Issyk-Ata stationary measuring site during one of the 10-minute measuring sessions, and the results of their primary processing using the algorithm of weight synchronous accumulation.
Fig. 17 shows the diagram of changes of apparent electrical resistivity of rocks corresponding to time delay at the transient curve t = 56 ms constructed on the data of signal recordings at Issyk-Ata stationary measuring site for about 2 years (from May 2009 until March 2011).
_%D0%BF%D0%B5%D1%80%D0%B2.jpg)
Fig. 16. Issyk-Ata measuring site, data of registration and primary processing: a) primary signal (10 minutes); b) result of synchronous weight accumulation; c) fragment of primary signal.
_56_%D0%B1%D0%B5%D0%B7%20%D1%82%D1%80%D0%B5%D0%BD%D0%B4%D0%B0.jpg)
Fig 17. Diagram of changes of apparent electrical resistivity of rocks received from the data of transient signal recordings at Issyk-Ata stationary measuring site for the period from May 2009 until March 2011.


